
The Fundamentals of Traction
What is Traction? Where does it come from? And, most importantly, how do you generate it?
Startups are in an endless pursuit of product-market fit. If they are very young, they might still be defining their vision of what the world will look like should they find it. If they are more mature, they are justifying to their next round of investors and strategic hires that they are strengthening their understanding of the early fit they’ve already established. This road is so well-traveled that the industry has adopted a name for the story of this pursuit: traction.
Just having product-market fit isn’t enough. A startup needs to prove it can achieve venture-scale.
Marc Andreessen eloquently defines product-market fit as “being in a good market with a product that can satisfy that market.” This sounds straightforward enough, but it takes time, money, trial, and error to prove a venture has found its fit. Furthermore, if a company wants to raise capital from professional venture capitalists, just having product-market fit isn’t enough. A company needs to prove it can achieve venture-scale. That’s why those in the startup ecosystem have invented the concept of Traction.
I’ve found myself thinking about the meaning of traction constantly as I lead a team that researches and coaches growth strategies to VC-backed startups. The importance of traction cannot be understated. If a founder can justify they have it, then they can more effectively inspire their teams and raise capital on favorable terms. If he or she cannot, then they will forever be stymied by uncertainty in their decision-making and consensus building.
Traction is a concept so fundamental to everything an early-stage company does that its striking lack of a commonly accepted definition is the impetus for my writing on this topic.
What is Traction?
Traction is the story of why a company is inevitably going to achieve venture-scale fit told through a compelling presentation of trends.
A trend is the general movement over time of a statistically detectable change; also a statistical curve reflecting this change. — Merriam-Webster
Constructing this narrative is as much an art as it is a science, and effectively assembling it requires an understanding of trends as they relate to the scalability of a particular venture. This requires an understanding of the fundamental nature of the particular startup, and how it relates to other successful startups that have told similar narratives.
A Brief Anatomy of a Startup
A startup is a business built around the delivery of its core innovation. Foundational’s innovation model is a simple visualization a startup having three layers: a go-to-market strategy atop an interface atop a core innovation. These are the primary colors by which any venture can be described. Together, they depict how the venture will accomplish its mission.
Each layer is dependent on the one beneath it, and they become increasingly more difficult to change as the outer layers are peeled away. For example, a go-to-market strategy can be changed relatively easily; a core innovation and the interface to it (collectively the product) may remain intact even though a business model might have undergone a drastic change (e.g., from B2C to B2B). Whereas if a core innovation has changed, the venture has likely undergone a significant pivot changing not only its solution but perhaps even the problem it addresses.
Describing a startup with the innovation model facilitates an understanding of how it might demonstrate compelling traction by enabling a comparison to companies having similar traits.
The Innovation Model in Practice

While there are other successful businesses that have similarities between each layer of their respective innovation models, each is uniquely described by all three.
Zipcar serves as an excellent example of a venture with a clear demarcation of its innovation, interface, and go-to-market strategy, in an ecosystem where others share one or two such traits. There are hundreds of ways its innovation could have been productized and scaled to a market. Creating a consumer car rental experience that was much simpler, more flexible, and faster than existing solutions served their mission and proved to be a winning combination.
Years later, Metromile adapted a nearly identical innovation to solve inefficiencies in auto insurance. (In their implementation a cellular device is used to track mileage, but remote access to the vehicle is not a feature.) Its pay-per-mile insurance product benefits low mileage drivers who aren’t as well served by traditional insurance providers. While its current customers are individual drivers (many of whom reside in dense urban markets), a variation to its go-to-market strategy could lead it to provide solutions to large rental fleets… perhaps even Zipcar’s.
Centers of Traction
A traction narrative can originate from six common storylines. In the general case, a startup is built on its founders’ belief that they’ve identified a unique solution to a market need, so it’s common to find that the centers of traction related to the innovation layer of the startup onion ring are sought to be developed first. This is usually followed by those in the interface layer, and finally those common to the go-to-market strategy layer. It’s in that order that we also define the centers of traction.

- Technology (Innovation)
- Product (Innovation & Interface)
- Sales / Revenue (Interface & GTM Strategy)
- Operations (Interface & GTM Strategy)
- Organization (GTM Strategy)
- Investors (Innovation & Interface & GTM Strategy)
Technology Traction
Traction originates from technology when there is a breakthrough that can be backed by an interesting trend that demonstrates its value. This is a great place to start the traction narrative when suddenly a problem can be solved that either wasn’t solvable or wasn’t affordable to solve previously.
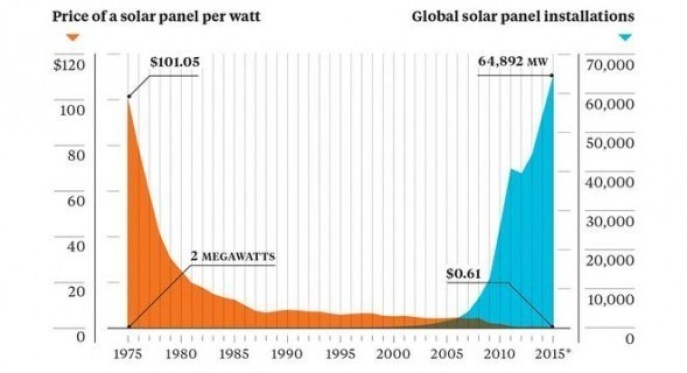
This chart illustrates the relationship between solar energy generation capacity and the price to produce that energy known as Swanson’s Law. If a venture is well positioned with an unfair advantage to leverage this trend, then this is the type of chart investors swoon over.
Product Traction
Product-centered traction demonstrates that the product offering has solved a big problem for its users. The two most straightforward ways to depict traction with a product are through engagement and organic acquisition.
User engagement answers the question of whether there are users that experience the solution and then become hooked (i.e., retention).

Facebook famously observed that once a user had 7 friends in 10 days they became much more engaged than the baseline user. They focused on refining their onboarding experience to facilitate new users achieving a network of 7 friends as quickly as possible.
In its early days, Twitter observers noticed a mouth-watering engagement characteristic through basic cohort analysis. The one in four new users who were posting messages into their second week were highly likely to remain engaged for a period of at least six months.

“This means by the second week of a cohort’s lifetime, Twitter can reliably predict its users’ future behavior as a group.” It’s no wonder Twitter was valued at $1B just two years after launching!
Organic acquisition demonstrates that early adopters are so excited about the product that they find it on their own or refer their friends to it. This is a noteworthy trend to observe because it combats the high CAC problem that plagues many startups between their seed and growth rounds.

Another beautiful visualization of theory in practice is that of the “Network Effect.” Metcalf’s Law states that the effect of a network is quantified by the square the connected users in the system. This is a great metric to focus on when creating a system reliant on peer-to-peer communication. When each participant also has a monetary value (as with an ad-supported social network), this is a truly awesome trend to prove.

User engagement and organic acquisition growth together are an extremely exciting combination.
Sales Traction
A traction narrative told in terms of sales is a story about how the “market” in product-market fit has been found. It’s important for this story to explain where sales come from, how easy they are to find, and the eventual growth of revenue due to the scalability of these channels. In Revenue Traction Doesn’t mean Product Market Fit about a company, Fred Wilson writes about a company that had strong initial revenue traction, but was plagued by churn due to a lack of product desirability. It ultimately went out of business due to its high burn rate coupled with a failure to pivot.

Renters insurance is a tough market to target; even in New York City, only 1 in 3 occupied units having a policy. What’s more is that existing policy holders are unlikely to switch providers due to the nature of the product and its long billing cycle. How then is a young tech startup to explain how it is successfully disrupting such a conservative space? In a report published shortly after its $34M series B financing, Lemonade elegantly explained its value proposition to millennials by segmenting its sales growth by those purchasing a renters insurance policy for the first time relative to the total New York City market.
You don’t need clairvoyance to see the predictive power of that metric. — Daniel Schreiber, CEO of Lemonade, Lemonade’s Crazy Market Share
While Lemonade had only a 1% total market-share, it was able to demonstrate that it had a wildly popular product among those entering the market for the first time.
Operational Traction
A business can also be attractive selling a familiar product to a familiar market, but with a logistical advantage that challenges the status quo business model in that space.

Provided Warby Parker could establish its lifestyle brand (which of course it did), its business model innovations of licensing its own designs, shipping direct to consumer, and pioneering a Home-Try-On experience, resulted in an undeniably great value proposition to the investors who have now valued it at over $1.75B. It’s glasses retail at half the price of the space’s incumbent Luxottica, yet its gross margins are only 10% lower at an impressive 73%.
Organizational Traction
Organizational health is often overlooked as a source of traction, but in an emerging field, a proven stable of world-class experts that know how to work together can be immensely valuable.
“Google knew Tony and the Nest team are world-class, once in a generation type hardware designers, and for that they were willing to pay a rich premium.” — Breaking Down The Valuation For Nest’s $3.2 Billion Purchase Price
In what may have been the biggest acquihire in history, Google purchased Nest for $3.2B in 2014, more than 10x of its projected annual revenue… they also bought the talents of a highly qualified team of 100 ex-Apple designers and engineers at a critical juncture in time when the smart home was finally gaining market acceptance.

Investor Traction
In today’s traction-centric venture capital market, the balance of power can appear to be in the investors’ favor, but founders must not forget the rarity of an investible venture-scale opportunity. The partners at venture capital funds are most challenged by limited access to qualified dealflow, and their obligation to a thesis that requires them to close a certain number of deals per year. These competing facts are two of the biggest reasons why most VC funds underperform public markets.
When an opportunity that seems hot presents itself, investors have a tendency to move quickly. They will also often seek to bring in others, especially in the early rounds, as a way to mitigate their risk. This effect can compound quickly once a term sheet is in place.

Wag, the on-demand dog walker app, had only 75 dog walkers in its system when it raised its $2.5M seed round in 2015… they had 14 participants.
Developing the Traction Narrative
It’s not necessary for a startup to depict its growth narrative in terms of all six centers of traction to convince others of its eventual product-market fit. Being able to do so for two or three, and then being able to avoid scrutiny on the others is typically sufficient. Benchmarking to results demonstrated by successful ventures with innovation model commonalities at a similar stage of growth serves as a good guide.
Once a team can identify its centers of traction, it can intentionally construct its narrative by conducting experiments that generate the data it needs to visualize its own compelling presentation of trends.
Author
Harlan Milkove is a repeat VC-backed startup founder, and Managing Partner at Foundational where he works with early-stage startups to expedite their pursuit of venture capital. His prior venture Reonomy, a commercial real estate data analytics platform, has gone on to raise $125M+.
Insights
Our perspectives, learnings, and insights on traction, venture capital, and product management.